Published July 11, 2011 10:40AM
Racer power data from the first week of the Tour de France
Stages 1-7 are in the books for this year’s Tour de France. The riders who survived the opening day’s crashes are starting to feel the effects of the blistering fast racing with the mountain stages just over the horizon.
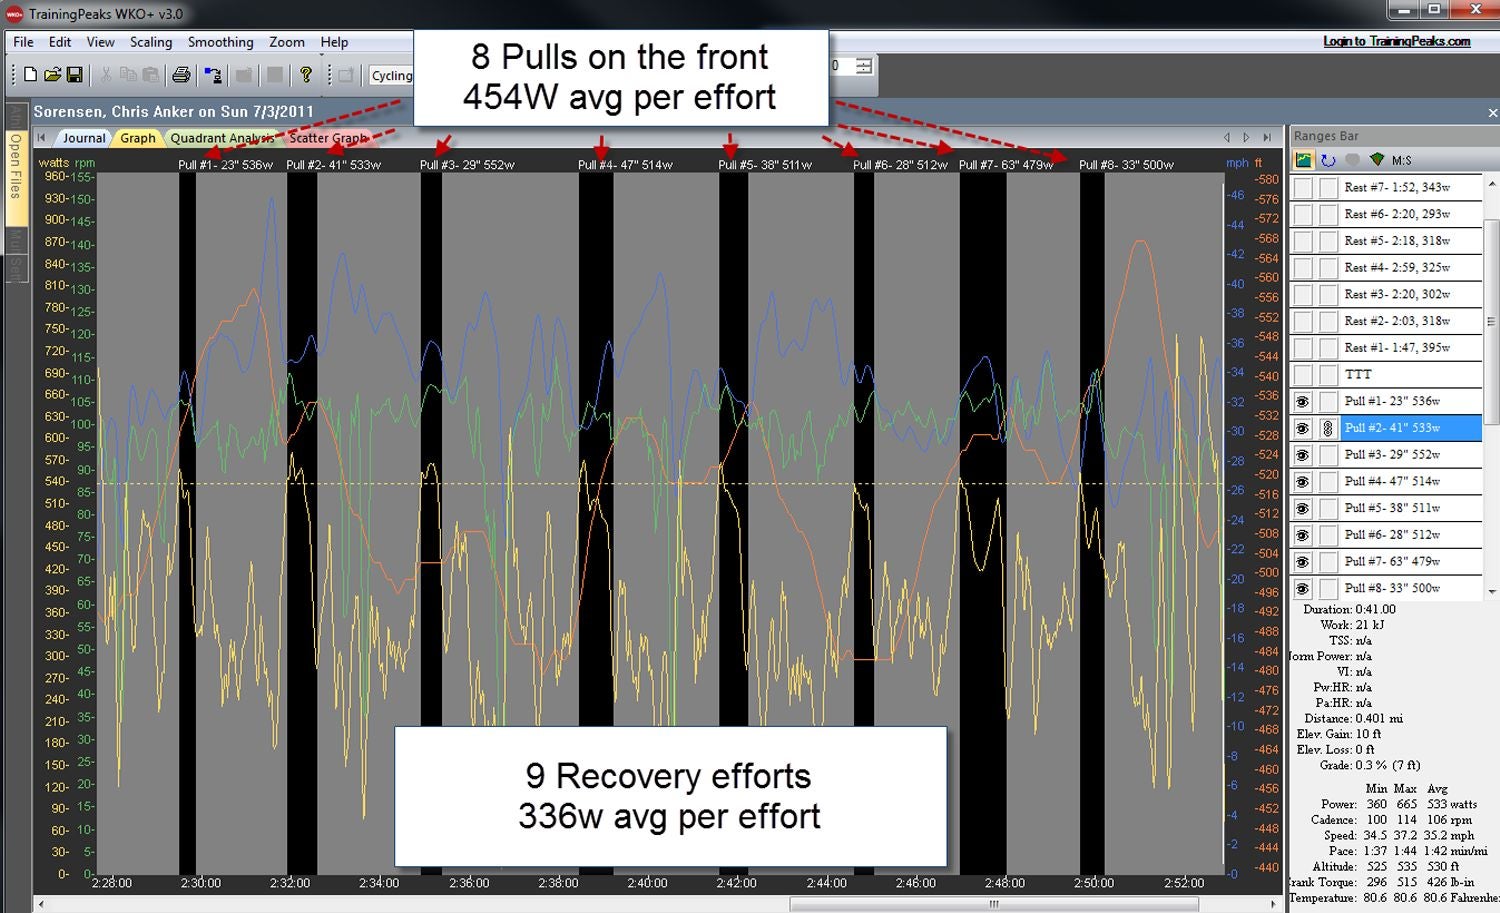
2011 Tour de France, Chris-Anker Sorensen stage 2 team time trial power data

Stages 1-7 are in the books for this year’s Tour de France. The riders who survived the opening day’s crashes are starting to feel the effects of the blistering fast racing with the mountain stages just over the horizon.
For a unique view into the demands of the world’s toughest race, TrainingPeaks is collecting and sharing daily power files in conjunction with SRM, Team Sky and Saxo Bank-SunGard. There is some amazing data coming out of the stages this past week and a very special thanks must also go out to the riders themselves who provide a unique insider view.
Chris Anker Sorensen of Saxo Bank-SunGard provided his daily Tour de France files for the past three years. Sorensen is a true mountain goat who will likely be one of the last men standing as the race hits the high mountains.
ADVERTISEMENT
Juan Antonio Flecha of Team Sky is providing his SRM power meter files as well. Flecha is a veteran classics rider who the team can look towards for leadership. You can see from the race analysis that Flecha is a loyal team worker and has already sacrificed his own chances for the over-arching team goals.
Three files worth the view:
Stage 2 Les Essarts team time trial – Chris Anker Sorensen | Full data

One file that’s well worth taking a look at is the stage 2 team time trial. Chris Anker Sorensen averaged 372 watts (396 normalized power) for 25:15. Sorensen rode on the front eight times at an average of 454 watts per pull. He led the team for five minutes and was “recovering” in the team slipstream for 20 minutes. His average watts while resting measured 336 watts.
If you were to turn this time trial into a race simulation workout you’d have to do eight, 30-60 second intervals at 120 percent of threshold, separated by 2-minute lower intensity efforts at 85 percent of threshold power.
Stage 5- Carhaix – Cap Frehel 158km – Chris Anker Sorensen | Full data
What a tough stage. On paper, it didn’t look so bad, but wow, this was tough even for the best in the world. Chris had to put out 317 watts (normalized) for the last 2 hours and 13 minutes and for a guy that weighs only 140 pounds, that is not easy! The average speed in those last 2 hours was 29.5mph and it wasn’t like Chris was just being sucked along in the peloton. This was in cross winds, up and down hills and in the gutter.

Stage 6 Dinan – Lisieux 226km – Juan Antonio Flecha | Full data
Flecha is one of the most valued veterans on Team Sky and a guy like this can save the day. Victories are set up by numerous teammates and the victory on stage 6 by Team Sky’s Edvald Boasson Hagen was aided by Flecha’s 1-minute all-out effort with 3km to go in the stage. Flecha averaged 667 watts for one minute to help place Edvald in a winning position next to Team Sky’s final lead out man, Geraint Thomas.
Stay tuned for more stage files as they become available at www.TrainingPeaks.com/tdf11