Published January 4, 2022 06:25AM
Technical FAQ: Tire rolling-resistance testing methodology and verification
Cycling wheel and tire experts offer opinions about and insights into tire testing.
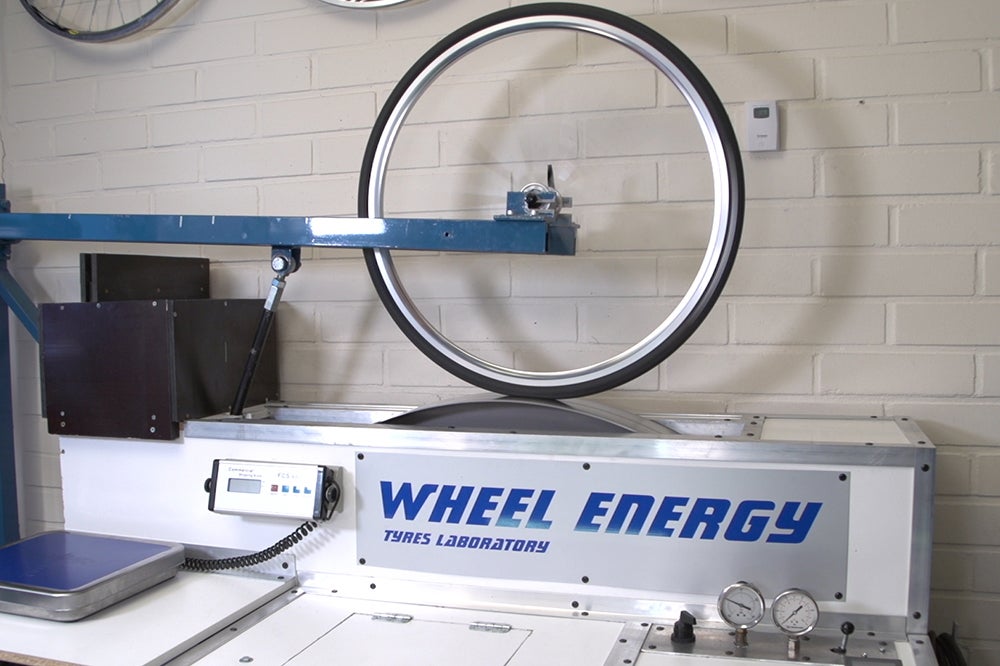
To test rolling resistance, Michelin sent its tires to Wheel Energy in Finland for third-party testing. Photo: Michelin
Have a question for Lennard? Please email him at veloqna@comcast.net to be included in Technical FAQ.
Dear Lennard,
I’m a long-time fan of your technical contributions to VeloNews and greatly admire your recent tire tests done on a roller device that simulates a real rider with damping and an actual surface with bumps. Tests on smooth drums have a long history of misleading choices (tires too narrow, pressures too high) for all but the most perfect surface conditions. But how has the device you apply been validated against real-world conditions? Does the amount of damping correspond to that of a typical active rider/racer’s body? What kind of road surface do the metal bumps simulate? My sense from having used and loved many of the tires at the top of your tests is that you have reasonably simulated broken pavement, chip seal, and perfect dirt roads. How might the tires compare in straight-ahead rolling on the rougher or looser sections characteristic of many “gravel” rides? I expect from experience that the wider softer supple tires will start to shine. Can the simulator even be validated without resorting to some kind of roll-down test?
— Bill
Dear Bill,
Here are answers from gurus of rolling-resistance testing, Josh Poertner of Silca (formerly technical director at Zipp) and Tom Anhalt of Cycling Analytics and the Blather ‘bout Bikes blog.
― Lennard
From Silca president Josh Poertner:
“I would say that the challenge with any lab testing is in limiting our reading of the results to be variables tested, while also being mindful of what is not being tested. In this case, what is being tested is purely the casing efficiency of the various tires with some secondary indication as to how casing efficiency affects the breakpoint pressure for some present, but the unquantified level of damping.
ADVERTISEMENT
I can tell you if you ran this same test on a smooth drum, the order of tires fastest to slowest would remain unchanged, but the data would show that the tires get faster and faster with [increasing] pressure and would not have shown any breakpoint. So, the key to me is to have a brutal understanding of what is and isn’t being tested here.
Unfortunately, the only way we can truly know the tire pressure breakpoint for a particular rider on a particular surface is to conduct virtual elevation testing (Chung Method testing), which is a methodology whereby we can use real-world data sets to back-out rider CdA and Crr to very high degrees of accuracy. Having done hundreds of these tests, what we find is that the ‘fastest tire’ in the field is the same one we find on the smooth or rough drum in the lab, but the breakpoint pressure depends greatly on rider size/weight/body composition, as that is what is ultimately driving the whole spring/mass/damper side of the equation.
If you wanted to test that with a machine, you’d have to do some sort of shake rig testing (as we do with racecars) to determine the spring/mass/damping relationship at each tire contact patch and then model that into your bump drum to simulate that spring/mass/damper on top of the tire. Again, the fastest tire will still be the fastest tire, but you could then accurately predict breakpoint!
ADVERTISEMENT
This is what makes our tire pressure calculator so unique; it is a curve fit of thousands of real-world virtual elevation data points taken with pro athletes over a 6+ year period. No, the challenge with this data set is that the selection of tires used is extremely top tier. So, the breakpoint is likely a bit high for those running less extravagant tires, and secondly, our athletes are the fittest in the world, so the breakpoint is likely higher than for the average consumer, as these data were produced with athletes all having very low body fat percentage and therefore, lower hysteresis than most normal people!
We’re actually building a parallel data set using more normal cyclists and are seeing slightly lower breakpoints than predicted by the calculator. I expect to have a body fat percent modifier added to the calculator.
My last thought here is that roll-down testing, as you know, is a terrible tool for looking at Crr, and I would go as far as saying that it really just can’t/doesn’t work unless you are trying to parse very good from very bad tires.”
— Josh Poertner, Silca president
From Tom Anhalt of Cycling Analytics:
“That is a good question and will be a good “teaching moment” on a couple of points.
ADVERTISEMENT
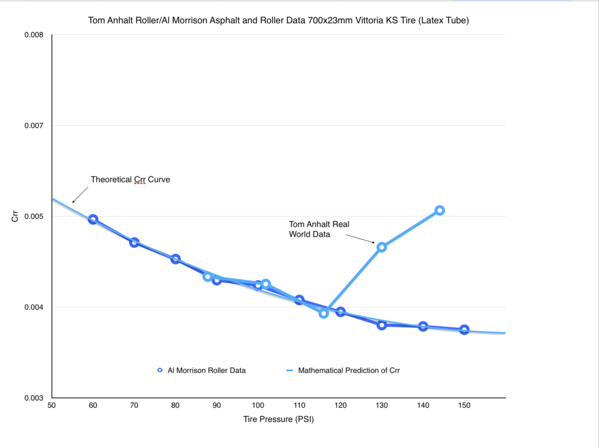
A quick look at the plot of rolling resistance vs. pressure on the Silca site that overlays the smooth roller test data with field test data (the plot that illustrates the “breakpoint pressure” concept) tells a lot about the validity of the method. Below breakpoint, the curves match. One can’t point to the plot as an illustration that higher pressures can be slower without accepting that match of test vs. real world at the lower pressures.
• Firstly, Bill states “Tests on smooth drums have a long history of misleading choices (tires too narrow, pressures too high) for all but the most perfect surface conditions.”
I would say that a more accurate statement is that misinterpretation of smooth drum tests has led to misleading conclusions, and really mostly about pressures. Smooth roller tests on tires of equivalent construction, but varying widths, shows that at equivalent pressures, wider tires test faster on the smooth drums, and, with “appropriate” pressures in each, are basically equivalent. Yes, smooth roller tests, or rough roller tests without damping, don’t properly demonstrate breakpoint pressures. Now that this is understood, it’s also important to remember that below breakpoint pressures, roller testing is a very valuable tool for evaluating tire hysteresis losses.
ADVERTISEMENT
• Next, for the question on damping, the damping of the air cylinder used by Wheel Energy is just a small fraction of the amount one would see from a human body, and so would tend to show “breakpoint” pressures higher than one would expect for “real world”…but, the fact that it does show a breakpoint indicates that the theory is correct. It’s just the absolute numbers might be off.
• Last, a roll-down test isn’t required to validate. A better method is Chung-style VE testing, which separates out the aero and rolling demands, and is what is represented by the Silca plot I mentioned earlier.
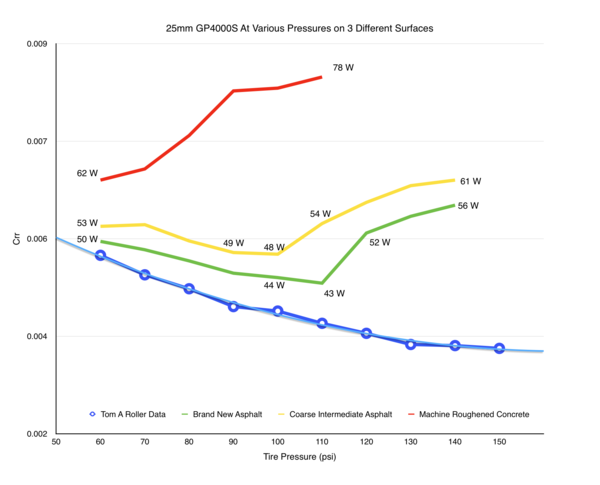
Another good plot for this point is the one of Crr vs Tire Pressure for various surface roughness, which shows the breakpoints as well.
This is how you validate the roller testing. Take the same tires and VE field test them and show that the rank order is the same. The percentage differences hold between tires when doing this. This makes sense, because below breakpoint pressures, by definition, the main contributor to rolling resistance is the hysteresis losses in the tire casing and tread, even on rough surfaces. And, as it turns out, roller testing is a very effective method of evaluating those losses.”
— Tom Anhalt
ADVERTISEMENT
Lennard Zinn, our longtime technical writer, joined VeloNews in 1987. He is also a custom frame builder (www.zinncycles.com) and purveyor of non-custom huge bikes (bikeclydesdale.com), a former U.S. national team rider, co-author of “The Haywire Heart,” and author of many bicycle books including “Zinn and the Art of Road Bike Maintenance,” “DVD, as well as “Zinn and the Art of Triathlon Bikes” and “Zinn’s Cycling Primer: Maintenance Tips and Skill Building for Cyclists.” He holds a bachelor’s in physics from Colorado College.
Follow @lennardzinn on Twitter.