Published February 23, 2021 12:08PM
Power Analysis: Phil Gaimon at the 2015 Redlands Classic versus Virtual Redlands Classic
An examination of the similarities and differences between virtual and in-real-life racing at the Redlands Classic.
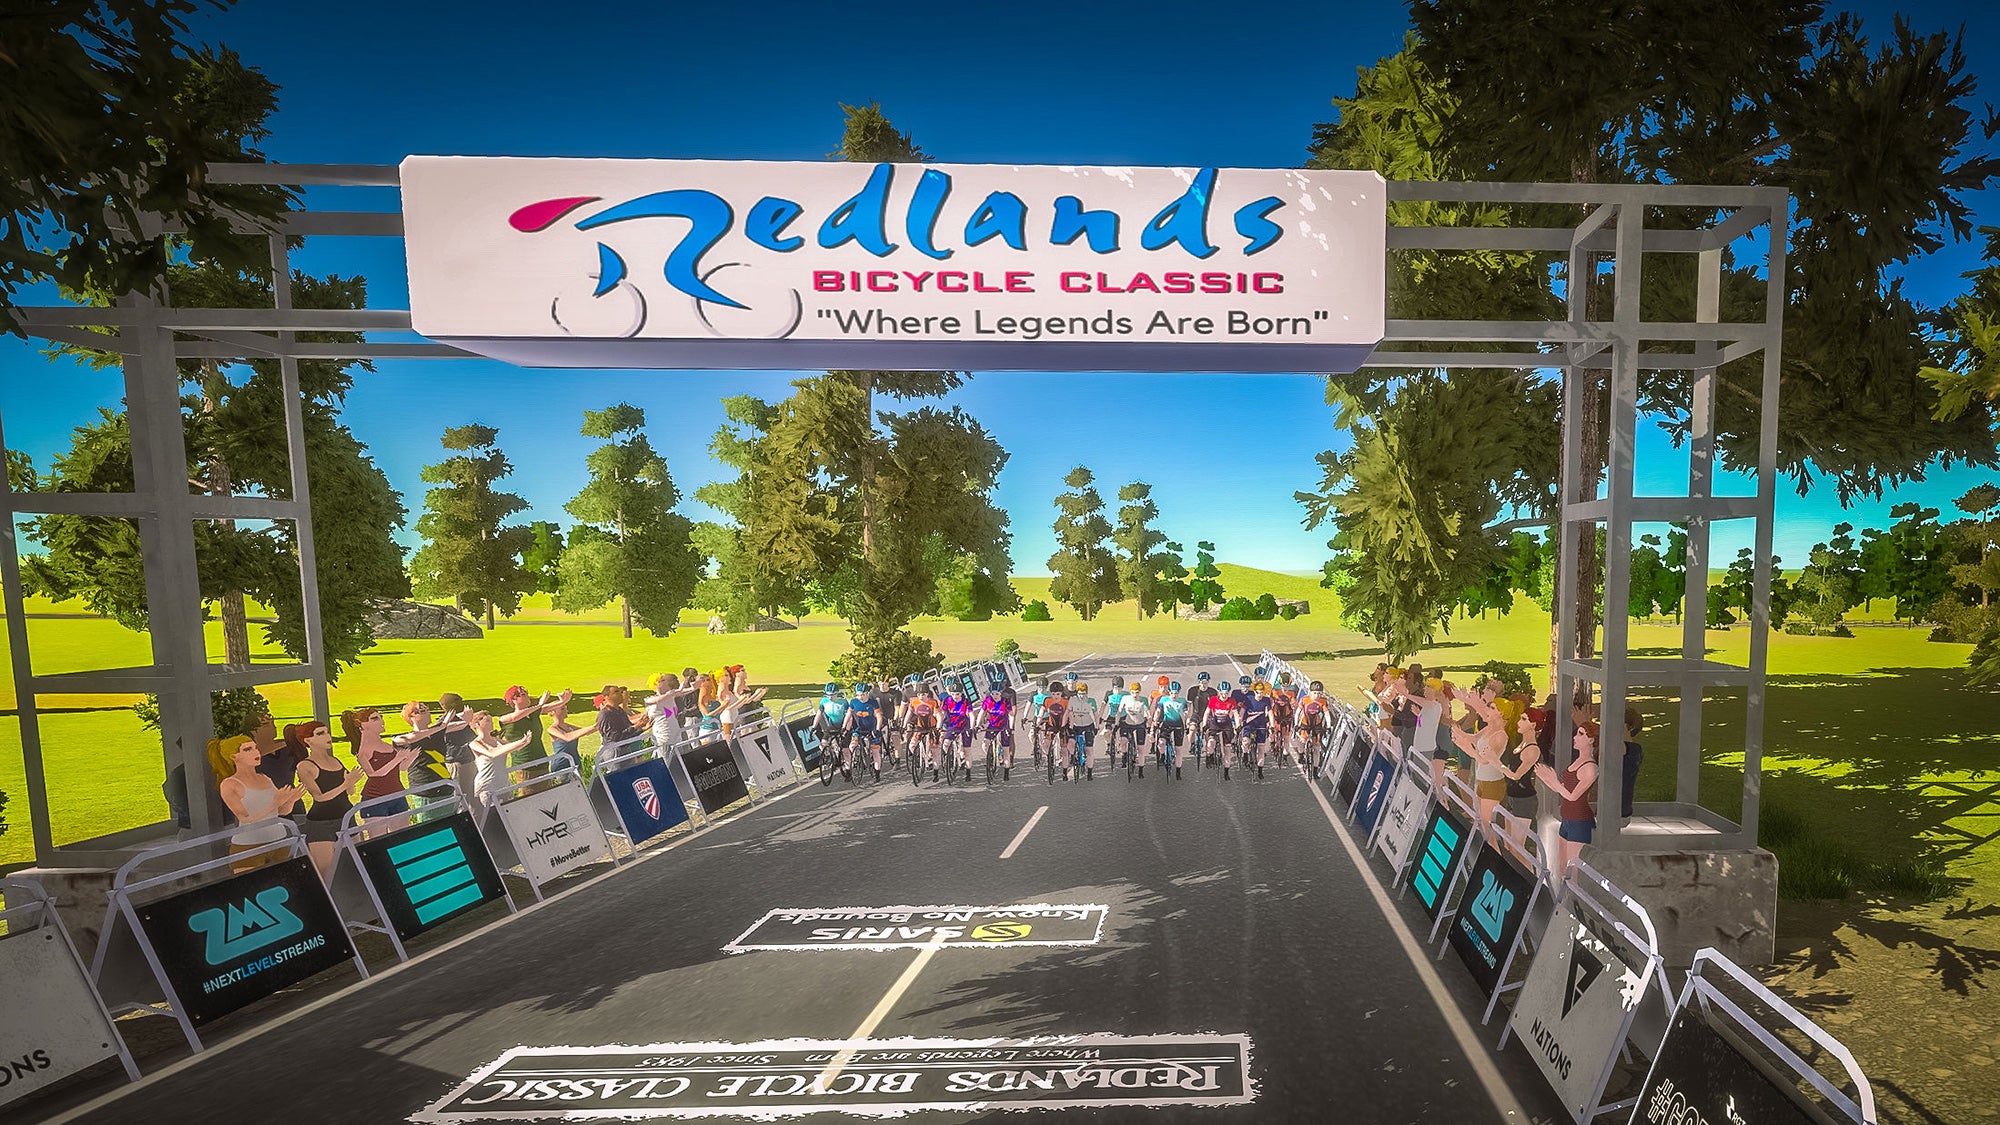
RGT Cycling hosts the virtual Redlands Classic.
The Big Bear time trial, the summit finish on Oak Glen, the downtown criterium, and the infamous Sunset Loop have been cornerstones of the Redlands Bicycle Classic, which is set to run for its 36th time in 2021. Amid the COVID chaos of 2020, the Redlands Classic was canceled along with the rest of the US Pro Road Tour calendar; but that didn’t stop thousands of hungry bike racers from competing in any way they could – and in January 2021, the virtual Redlands Bicycle Classic on RGT Cycling attracted hundreds of amateurs and an assembly of professional eracers to its 3-day stage race reincarnation as part of the Echelon Racing League on RGT.
For each stage of the Virtual Redlands Classic, Project Echelon uploaded GPX files from the real-life Redlands courses, which RGT then converted into “Magic Roads” with matching elevation and course profiles to the real race. The Virtual Redlands Classic started with a 9.3km individual Time Trial finishing at Panorama Point, followed by six laps around the Sunset Loop for Stage 2, and finally, the 67km Queen Stage finishing atop Oak Glen.
I raced the IRL Redlands Classic in 2018 and 2019, as well as the Virtual Redlands Classic just a few weekends ago. My virtual success was greater than IRL, as I managed to win the final stage of the virtual race and place 3rd on the virtual Sunset Loop. But my experiences in both real-life and virtual worlds give me a unique personal perspective.
ADVERTISEMENT
It is also important to note that the RGT platform is similar to — but different from — the most popular virtual cycling app in the world: Zwift. RGT is much more like outdoor riding, with braking effects in the corners, collision interaction, and a more powerful drafting effect compared to Zwift.
These nuances were felt the strongest during stage 2 of the Virtual Redlands Classic around the Sunset Loop which included a punchy nearly-6-minute climb, plenty of rollers, a technical descent, and a number of tight S-turns. For many in the professional and amateur fields it was the hardest virtual race they’d ever done – and little did they know what was to come on stage 3.
Nehr – vRedlands stage 2:
Time: 1:36:14
Average Power: 325w (4.5w/kg)
Normalized Power: 366w (5.1w/kg)
Peak 6-minute-power: 429w (6w/kg)
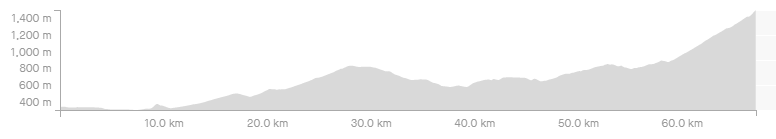
The Queen Stage of the virtual Redlands Classic was set for 67km and over 1,600m (5,300 feet) of climbing, with a summit finish at the top of Oak Glen. It was unlike anything that the real-life Redlands has ever seen – the menacing course was almost all uphill, with climbs up the Baseline Street (the ultra-steep finish of the Highland Circuit Race), a tough climb up Greenspot Road, and the long false flat climb of the Yucaipa Road Race to sap the legs of the weary. And after all that, the only thing left is the category 1 climb to the top of Oak Glen: 8.5 kilometers with an average of 6.7 percent, including a final 600m stretch with an average pitch exceeding 11.6 percent.
A strong group of 50 pro men rolled out at the beginning stage 3, and it wasn’t long before the field split into bits on the first climb of the day: Baseline Street. With gradients approaching 15 percent, the 90-second climb was a fitting and lactate-filled introduction to the brutal queen stage.
ADVERTISEMENT
Nehr – Baseline Street climb:
Time: 1:16
Average Power: 512w (7.1w/kg)
Very quickly the field was narrowed down to 30 riders inside the first 10km of racing. A few stragglers clawed their way back to the main group before we began the long climb up Greenspot Road. Not yet featured in a road stage of the real-life Redlands Classic, the Greenspot climb is not too long and not too steep; but at the end of the day, these long ‘sweetspot-type’ efforts quickly add up.
Nehr – Greenspot climb:
Time: 10:34
Average Power: 325w (4.5w/kg)
Average Heart Rate: 152bpm
Max Heart Rate: 162bpm
These fatigue-building efforts on false flats or gradual climbs are far more present in real-life road racing than in the virtual world, mostly because real-life road races are two to three times as long. 10 minutes at 4.5w/kg may feel relatively easy for elite-level riders, but if you do four, five, or six of those efforts into a four-hour race, they quickly add up. On stage 3 of the Virtual Redlands Classic, the accumulation of fatigue began to chip away at our legs as the road seemed to climb forever. With so little rest throughout the stage, the stage was truly a survival-of-the-fittest scenario before we even reached the final climb.
In the early section of the race, it was impossible to win, but it was certainly possible to lose. By going too hard too early, and spending too much time in the virtual wind, riders were burning up their precious matches that they would need to win atop Oak Glen. I sat in the draft as much as possible on these climbs, keeping my heart down – around my tempo zone – and saving my energy for the final climb.
ADVERTISEMENT
Nehr – Greenspot and Yucaipa climbs:
Time: 31:17
Average Power: 333w (4.6w/kg)
Average Heart Rate: 156bpm
Max Heart Rate: 170bpm
At the crest of the Yucaipa climb, there were only 25 riders remaining; the hard part was still to come.
The run-in to Oak Glen was no easy coast. After a brief descent, we still had 20km of gradual climbing before we reached the lower slopes of the final climb. There were a few steep pitches, but nothing crazy, and a couple of testing attacks came from Charlie Velez (Hewdog Racing) and Bruce Bird (DRAFT). Once again, I sat in the group, saving as much energy and possible, and patiently waiting for the final climb.
ADVERTISEMENT
The race of attrition left just 19 riders in the lead group by the base of Oak Glen – Charlie Beake (Team for 2000 | Kalas) led the charge at over 6w/kg as the field strung out behind. The first half of Oak Glen is an incredibly steady 6-7 percent that turns into a threshold-effort grind at over 400w. With 6km to go, there were just nine of us remaining.
By 4km to go, the road began to bend and pitch, and I had to push over 500w just to stay on the wheel ahead of me. My heartfelt like it was going to explode after 15 minutes at 175bpm, but I knew my saving grace would be the flat section of road at 3km to go where I was able to catch my breath for a few precious moments.
Ryan Rudderham (DRAFT) attacked off the front group with 2.5km to go, and I didn’t even think about trying to respond. I had my Project Echelon teammates in my ears (blasting alongside with The Cure) telling me to wait until precisely 220m to go to launch my final sprint. We had done our course recon and knew that after a long and steady climb, the pitches of virtual Oak Glen suddenly kicked up to 11 percent with 600m to go. Normally, 600m to go isn’t that far, but with pitches of 10-15 percent all the way to the line, the final 600m took us over two minutes, even pushing more than 450w.
ADVERTISEMENT
Spencer Seggebruch (CANYON eSports) attacked first, and I immediately jumped on his wheel. I thought about attacking over the top, but as my teammates had told me, it was too early. When Mat Usborne (Above & Beyond Cancer) came around me, I did everything I could to stay on this wheel, but he slowly started drifting away. And with 200m to go, I knew it was “now or never.”
There wasn’t much of an actual sprint to be had at the end of such a brutal climb, at the end of such a brutal stage. I didn’t even break 700w on the run-in to the line but pulled away in the final few meters to take a clear victory over Usborne and Rudderham. I dug so deep that I can hardly remember those final few hundred meters, but I do remember crossing the line first and collapsing over my handlebars, equally ecstatic and exhausted after nearly two hours of full gas racing.
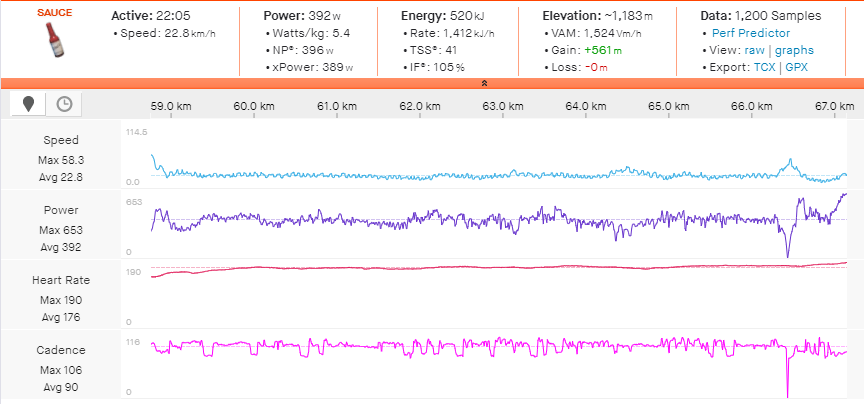
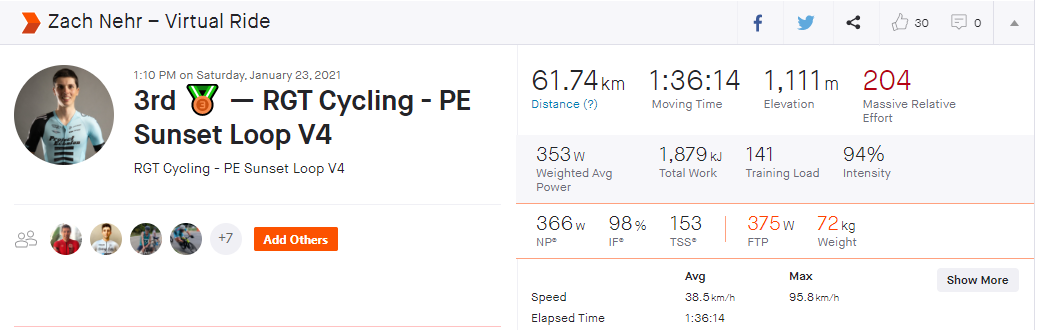
Nehr – Oak Glen climb:
Time: 22:05
Average Power: 392w (5.4w/kg)
Final 600m:
Time: 2:05
Average Power: 479w (6.7w/kg)
Out of curiosity, I wanted to see how my time up Oak Glen compared to the real-life Redlands Classic. Despite different start and finish lines, we can compare a large section of my Oak Glen climb to the 2015 Redlands Classic, in which Phil Gaimon famously took the lead at the “Chris Horner cycling classic”, in his words.
ADVERTISEMENT
The virtual Redlands Classic and the 2015 Redlands Classic climbed the same 7km section of Oak Glen, with the real-life edition finishing in front of the Oak Glen Tavern, whereas the virtual version still had 1km of the steepest roads to come. Nevertheless, it is interesting to see how much faster the real-life race was, even though they had been racing for over three hours by the time they hit the bottom of the final climb.
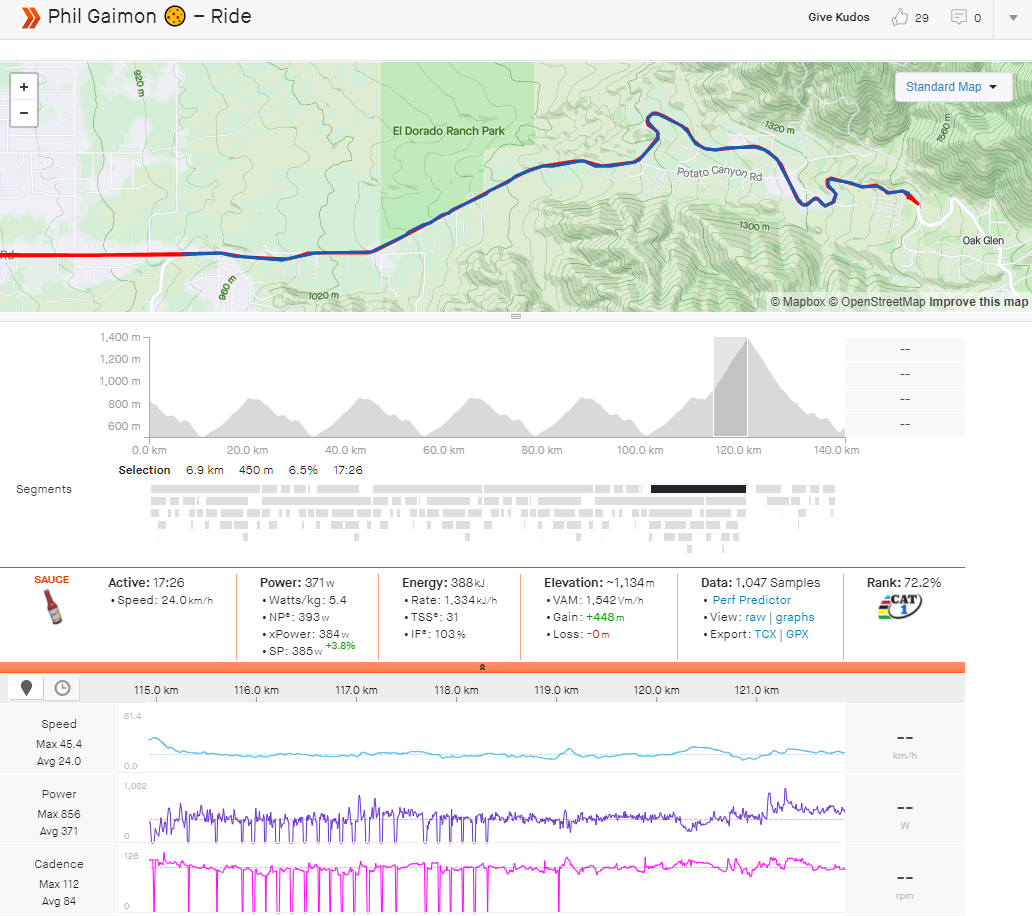
Gaimon (Optum-Kelly Benefit Strategies) – Oak Glen climb, 2015:
Time: 17:26
Average Power: 371w (5.4w/kg)
Normalized Power: 393w (5.7w/kg)
Winning Attack: 551w (8.1w/kg) for 1:41
Nehr – 7km section of Oak Glen climb:
Time: 18:24
Average Power: 384w (5.3w/kg)
Before we compare apples to apples, we have to acknowledge that one of these races is not, in actual fact, an apple. In other words, it would be unfair to directly compare the virtual Redlands Classic to the real-life Redlands Classic. Real-life racing is much more complicated in terms of positioning, drafting, and the technical skills required, as well as dealing with real-world heat and wind.
ADVERTISEMENT
We must also keep in mind that the Virtual Redlands Classic was a very short and very intense race, whereas the real-life Redlands is a much more drawn-out affair. There are five stages instead of three, and the road races are more than twice as long at three to four hours each. In the end, real-life racing requires an extra layer of endurance training that is not a requirement – but neither a detriment – to virtual racing.
Coaches and physiologists love to look at the kJs burned (kilojoules burned) metric in elite-level cycling. Kilojoules burned refers to the physical expenditure during a workout, and how much energy (in kilojoules or calories) has been burned. We can estimate the number of kilojoules burned during a cycling workout using this equation: kilojoules = watts X seconds / 1000.
When you have just started a training ride, you have burned 0kJs. A coffee ride typically burns 200 – 400kJs/hour; during a high-intensity training ride or race, professional cyclists may burn anywhere from 800 – 1,400/hour. This an extremely high workload, and is also the reason why cyclists need to eat on the bike in order to replace some of the energy lost and to avoid “bonking.”
ADVERTISEMENT
Kilojoules burned comes into play when we are comparing professional road racing to amateur road racing and or virtual racing. In professional road races such as the Tour de France, riders are hitting the bottom of the final climb such as Mont Ventoux after three to four hours of racing and having already burned over 3,500kJs. Contrast that to criteriums or virtual racing where the longest events are one to two hours, and riders reach the finish having only burned around 1,000kJs. There is a huge difference between racing up a summit finish after 30 minutes of racing versus after four hours of racing.
Normally, I would expect the difference in kJs burned between a real-life road race and its virtual counterpart to be vastly different; but the Virtual Redlands Classic and 2015 Redlands Classic ended up being comparatively similar. Even though Gaimon had been riding for three hours when he hit the bottom of Oak Glen, he had only burned a relatively modest 1,910kJs. I had been racing for just 90 minutes before the start of Oak Glen, but the intensity was so high during the Virtual Redlands Classic that I had already burned 1,617kJs.
Due to the nature of virtual racing and the differing Oak Glen stage profiles, the overall workload was significantly higher in the Virtual Redlands Classic compared with the real-life race in 2015.
ADVERTISEMENT
In the end, each performance is impressive in its own right. Virtual racing requires a level of mental focus and willingness to suffer in isolation that is unlike any real-life road racing experience. But in real-life racing, there is a thrilling danger factor that can have you — quite literally — riding on the edge of your seat, while also pushing 500 watts.
As a member of Project Echelon, I was especially proud to bring home the win in the queen stage of the Virtual Redlands Classic. In February 2020, I had never done a virtual bike race before – on Zwift, on RGT, on any platform. But as the world changed, I jumped into eracing as if it was all we had — which turned out to be the case. I never could’ve predicted the rise of eracing and the professional platform of the Echelon Racing League. Season 1 of the Echelon Racing League draws to a close on March 11-14 with the Virtual Tour of America’s Dairyland, highlighting a number of new crit courses that will make up the biggest crit series in the U.S.
***
Power Analysis data courtesy of Strava
Project Echelon and Echelon Racing Promotions helped organize and police the Virtual Tour of the Gila, using weigh-in videos, power calibration, and more technologies and protocols to ensure rider data and subsequent results were as accurate as possible. Special thanks for all of their hard work.
Riders:
Zach Nehr – Virtual Redlands stage 2
Mat Usborne – Virtual Redlands stage 2
Ryan Rudderham – Virtual Redlands stage 2
Phil Gaimon – 2015 Redlands stage 3
Virtual Redlands Classic – Echelon Racing League pro men stage 3
Results
Livestream of the Virtual Redlands Classic – Echelon Racing League:
Stage 2